This blog post was originally published at e-con Systems’ website. It is reprinted here with the permission of e-con Systems.
In this blog, we’re diving deep into sensor resolution and its impact on camera performance. Understanding sensor resolution is key to choosing the right camera for your needs. Keep reading for insights that will empower you on your next camera purchase!
Resolution can be defined as the number of distinct elements that a sensor can capture, i.e., the sensor’s ability to distinguish between two closely spaced points. It is specified in pixels. A higher pixel count translates to a sharper image with more detail.
A high-resolution image lets you see finer details and smoother transitions between colors. You can also zoom really close into a high-resolution image without the picture getting blurry. This is because there are enough pixels to show all the details even when the image is magnified.
In this blog, we are delving deeper into the concept of resolution from a sensor perspective. Keep reading to have a better understanding of resolution next time you choose a camera!
What is Spatial Frequency? How Can We Define Resolution in Terms of Frequency Domain?
Spatial frequency describes how often changes in brightness occur across an image. It’s like measuring how many cycles of light and dark you see within a certain distance.
Spatial frequency of a signal can be represented by frequency domain. Frequency domain is a mathematical way of representing a signal as a sum of sinusoidal components of various frequencies.
Here’s how spatial frequency connects to resolution:
- High spatial frequency: In a high spatial frequency image, there are many frequent changes in brightness, indicating fine details like sharp edges or thin lines. It will have rapid changes in pixel intensity and high contrast areas. This translates to a high-resolution image. Imagine a graph with many peaks and valleys close together (refer to Figure 1).
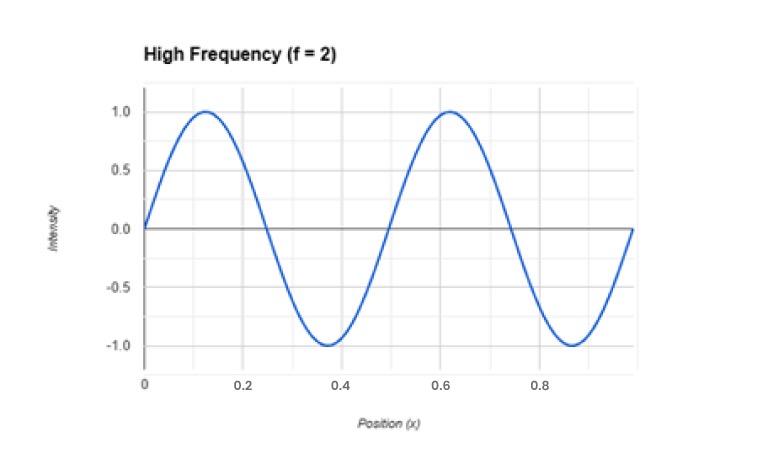 Figure 1: High Frequency Sinusoidal Wave
- Low spatial frequency: In a low spatial frequency image, there are few changes in brightness, indicating large areas of uniform color or blurry details. This signifies gradual variations in pixel intensity, typically found in smooth regions with minimal contrast or large, blurry objects. This translates to a low-resolution image. Imagine a graph with only a few wide bumps and dips (refer to Figure 2)
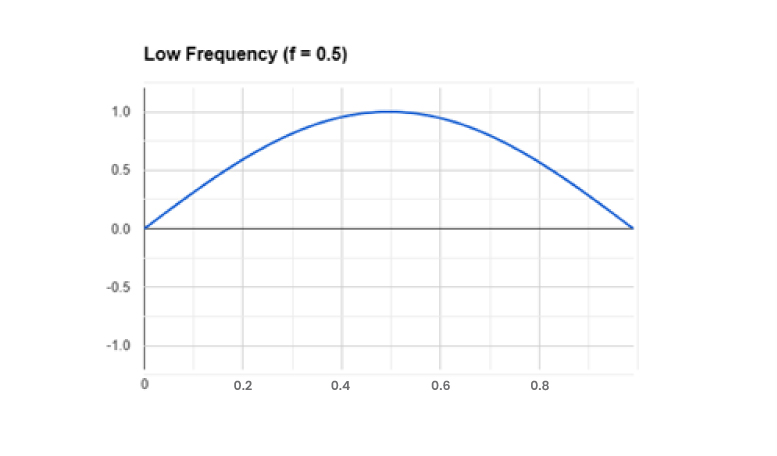 Figure 2: Low Frequency Sinusoidal Wave
Resolution in the frequency domain refers to the ability to distinguish between closely spaced frequency components in the signal. Resolution essentially determines the maximum spatial frequency an image can capture. A high-resolution image can capture high spatial frequencies (fine details), while a low-resolution image is limited to capturing only low spatial frequencies (less detail).
Let us understand the spatial frequency through a tangible example. Consider the image given below (See Figure 3).
Different scenes in the image have different spatial frequencies. The region with the fence has increasing spatial frequencies as the intensity values oscillate more rapidly. The sky has a low frequency as there are no significant intensity variations. The tower has a medium frequency.
 Figure 3: Spatial Frequency Example Image
[Image Source: Kaggle, Kodak Dataset]
What is Sampling? How Can Sampling Be Used to Attain Better Resolution?
Sampling is the process of converting the continuous signal into a series of discrete measurements. A higher sampling rate captures more detail of the original signal.
In terms of a digital image, the sensor captures snippets of a scene by dividing it into a grid of tiny squares, like a mosaic. Each square is called a pixel, and it represents a tiny sample of the whole image. This is called sampling.
The number of times the sensor samples the scene (across both width and height) determines the resolution of the image. More samples (pixels) result in a higher resolution and a more detailed image.
Image resolution is expressed in terms of pixel dimensions (e.g., 1920×1080 pixels). This indicates the number of samples (pixels) used to capture the original scene. Higher resolution means more samples and, therefore, a more detailed image but also a larger file size.
How does Undersampling Affect Resolution?
Undersampling refers to a situation where the individual pixels on a sensor are too large or too few in number to accurately capture the details of the scene being imaged. If there aren’t enough pixels spatially to sample the details in the scene, it can lead to different types of imaging artifacts.
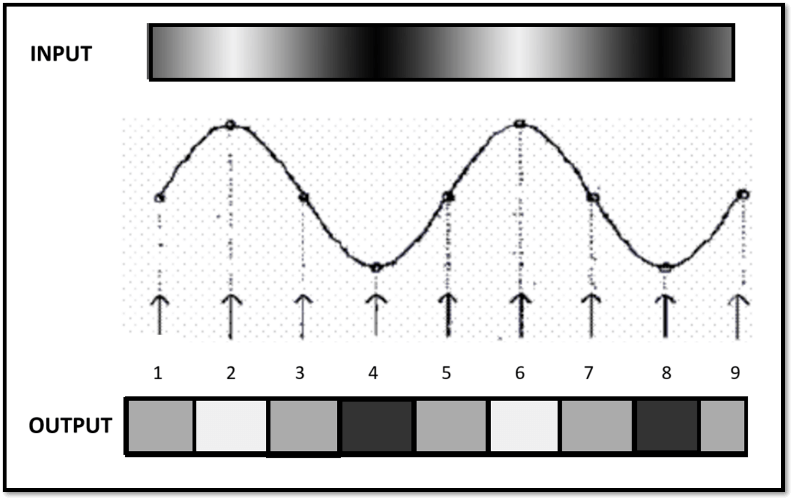 Figure 4: Low Frequency Input Signal and Low Frequency Sampling
[Image Source: Marc Levoy Digital Photography]
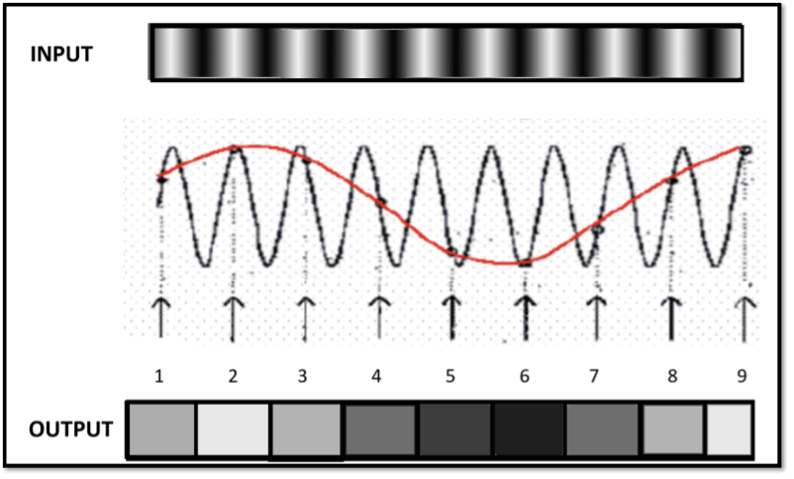 Figure 5: High Frequency Input Signal and Low Frequency Sampling (Undersampling)
[Image Source: Marc Levoy Digital Photography]
Undersampling can be understood from the above given figures (Refer to figure 4 & figure 5). It can be seen in Figure 5 that, due to insufficient sampling rate, the high-frequency input is represented as low-frequency output.
Imaging artifacts caused by undersampling are called aliasing. Aliasing happens when the details of the scene are too small for the sensor to resolve properly, leading to misinterpretations.
Aliasing can occur in the following forms:
- Jagged Edges: Straight lines appear stepped or stair-cased instead of smooth.
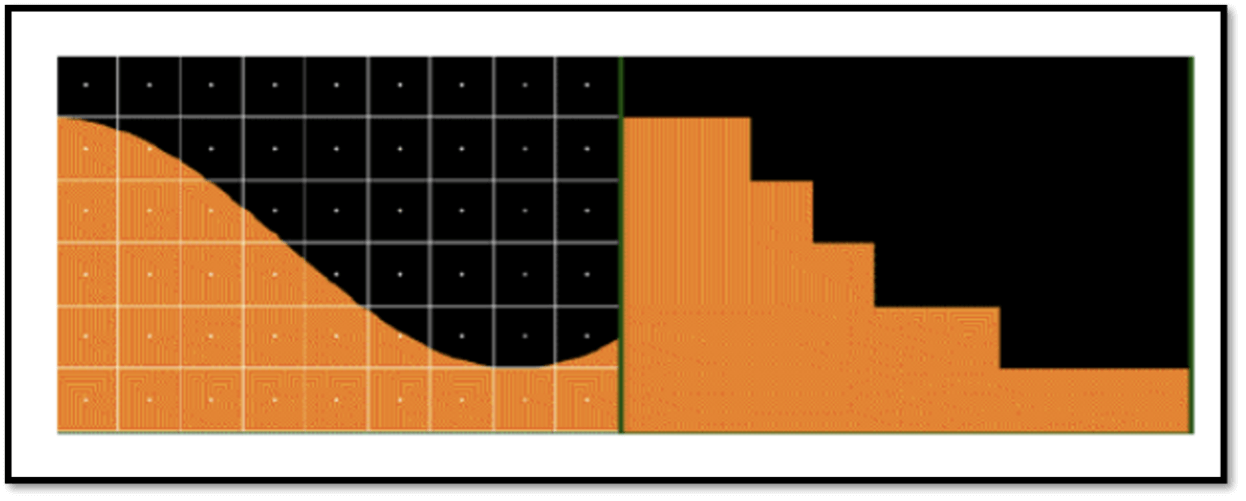 Figure 6: Jagged Edges
- Moiré Patterns: Fine, repeating patterns in the scene (like a person’s striped shirt or brick wall) can create wavy or moiré interference patterns on the image.
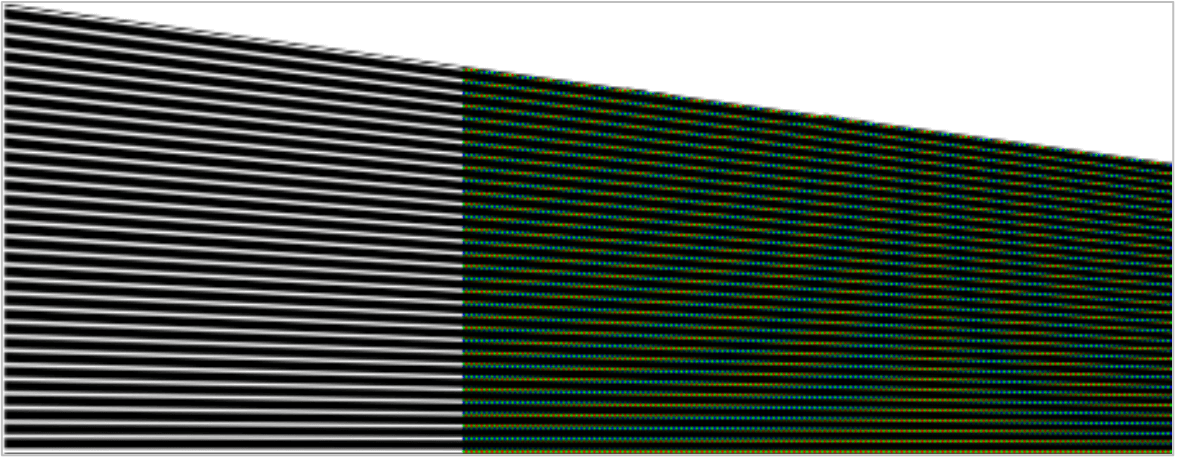 Figure 7: Moire Edges
- Color Fringing: Sharp transitions between colors, especially high-contrast edges, might exhibit a colored halo or fringe around them.
 Figure 8: Color Fringing or Chromatic Abberation
Nyquist-Shannon Sampling Theorem
The Nyquist-Shannon criteria states that to accurately capture the details in the original scene (signal), the sampling rate (number of pixels) needs to be at least twice the highest frequency (smallest detail) present in the scene. That is, if a signal has the highest frequency of f_max, then the sampling rate (the number of samples taken per unit time) must be greater than or equal to 2 * f_max. At least two samples are required to represent one cycle to truly reproduce the input frequency.
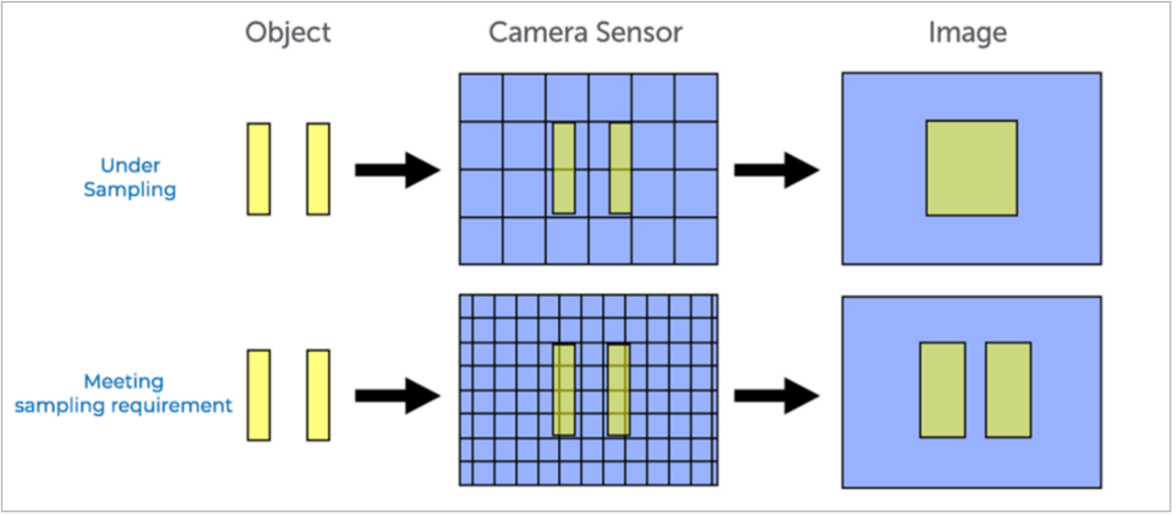
Figure 9: Sampling
Hence, a camera sensor with a higher resolution (more megapixels) has more pixels capturing details. This allows it to capture finer variations in light and color, translating to sharper images.
Anti-Aliasing Filters to Avoid Undersampling
The primary technique to combat undersampling and its resulting aliasing artifacts is the use of anti-aliasing filters (AA filters). These filters are placed in front of the sensor and act like a low-pass filter. They attenuate high-frequency components in the incoming light before it hits the sensor. By reducing the signal bandwidth, they effectively prevent aliasing caused by undersampling.
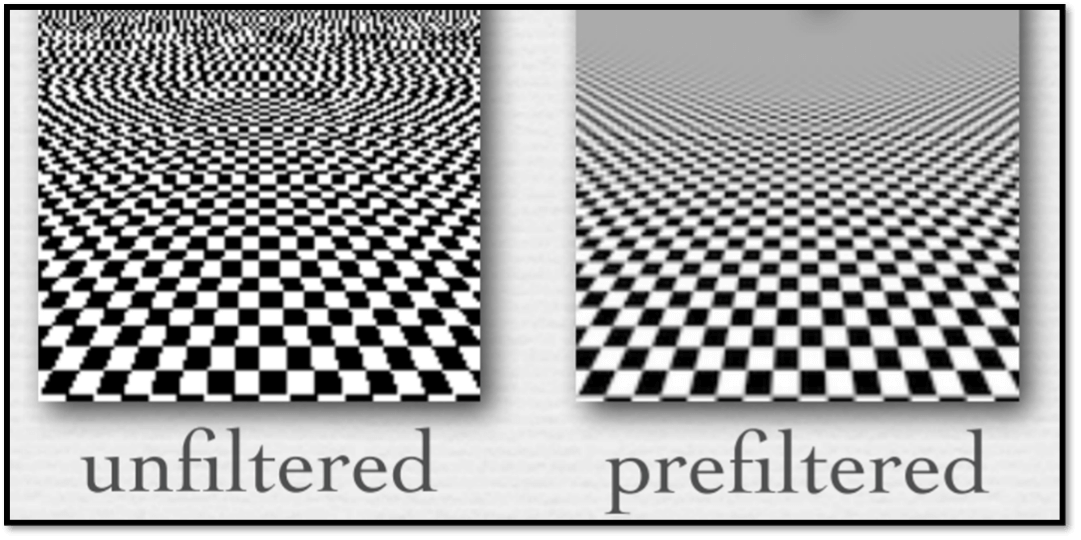
Figure 10: Prefiltering
[Image Source: Marc Levoy Digital Photography]
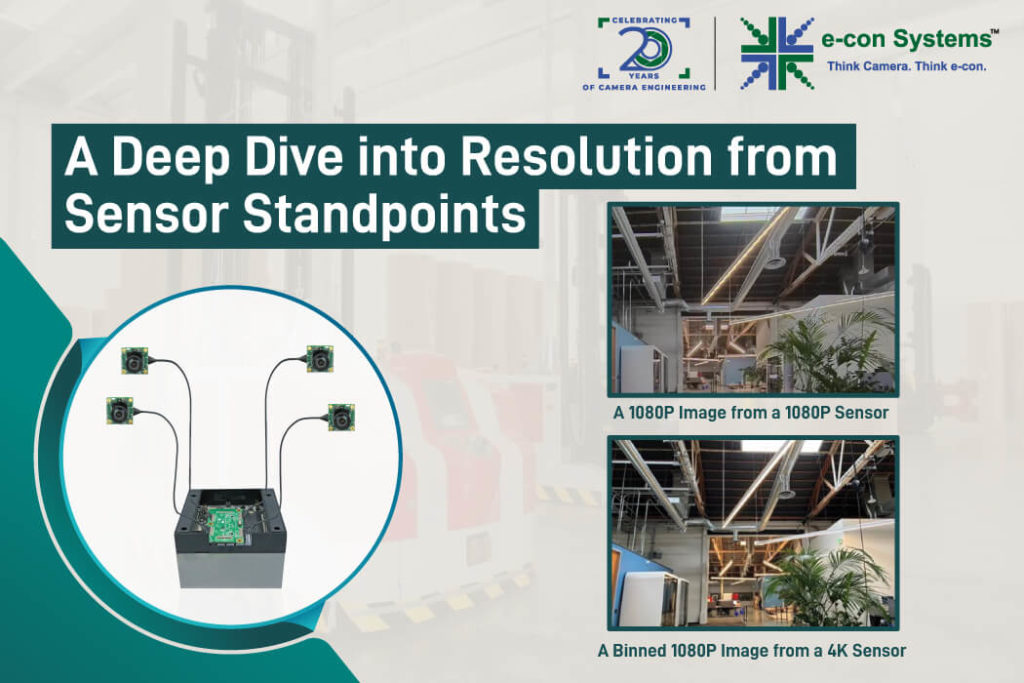
One key takeaway from understanding sampling and its relevance in imaging is that “sampling resolution matters more than final output resolution.” This means that a 1080P binned/resized image from a 4K sensor is always better than a 1080P image from a 1080P sensor (Refer to Figures 11 and 12).
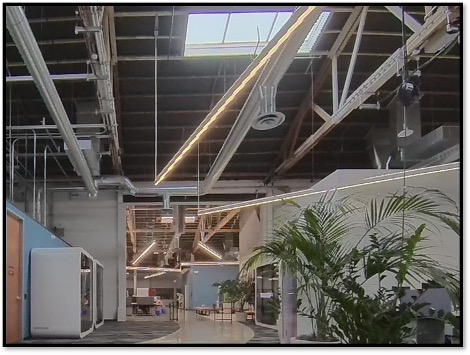
Figure 11: A 1080P Image from a 1080P Sensor
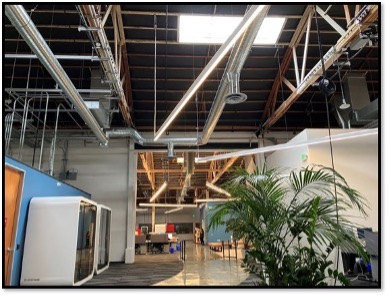
Figure 12: A Binned 1080P Image from a 4K Sensor
Choose e-con Systems Cameras Featuring Advanced Sensor Technologies
e-con Systems is an industry pioneer with 20+ years of experience in designing, developing, and manufacturing OEM cameras.
Our cameras feature advanced sensors from Sony, Omnivision, and Onsemi. These sensors tackle imaging artifacts efficiently and yield high-resolution images.
Take a look at our newly launched camera – e-CAM56_CUOAGX integrated with SONY Pregius S IMX568 Sensor.
Visit e-con Systems Camera Selector Page to find cameras of your desired specifications.
We also provide customization services and expert assistance to help you design the right camera for your application.
Write to us at [email protected] for queries and more information.
Prabu Kumar
Chief Technology Officer and Head of Camera Products, e-con Systems