This article was originally published at NVIDIA’s website. It is reprinted here with the permission of NVIDIA.
Intelligent Transportation Systems (ITS) applications are becoming increasingly valuable and prevalent in modern urban environments. The benefits of using ITS applications include:
- Increasing traffic efficiency: By analyzing real-time traffic data, ITS can optimize traffic flow, reducing congestion and improving travel times.
- Enhancing safety: ITS can detect potential hazards, monitor traffic violations, and manage incidents more effectively, leading to safer roads.
- Improving environmental sustainability: Efficient traffic management reduces fuel consumption and emissions, contributing to environmental sustainability.
Importantly, these systems need to process information at the edge for reliable bandwidth, privacy, real-time analytics, and more.
This post explains how to use the new Jetson Platform Services from NVIDIA JetPack 6.0 to implement an end-to-end traffic analytics solution for the edge. This system consists of video ingestion and storage using the Video Storage Toolkit (VST) service, real-time object detection and vehicle tracking with YOLOv8 and the DeepStream AI Perception service, and a spatio-temporal analysis of vehicle movement. Once the pipeline is created, APIs are used to generate analytics.
Benefits of Jetson Platform Services
Building and deploying AI applications using Jetson Platform Services and NVIDIA Jetpack offers the following benefits:
- Fast, efficient solutions: The rich collection of optimized API-driven microservices can help reduce time to solution.
- Scalability: The microservices architecture enables independent scaling of various components, optimizing resource utilization based on demand.
- Modularity: Breaking the application into smaller, manageable services simplifies updates, maintenance, and troubleshooting.
- Flexibility: Services can be configured and deployed in numerous ways, providing tailored solutions for specific ITS needs, whether for monitoring traffic, managing intersections, or ensuring pedestrian safety.
To learn more about the features of the latest JetPack SDK, see Power Cloud-Native Microservices at the Edge with NVIDIA JetPack 6.0, Now GA.
Application overview
This ITS application uses three primary services: the Video Storage Toolkit (VST) service, the AI Perception service, and the AI Analytics service. It also uses several foundation services, such as Redis Message Bus, API Gateway, and IoT Gateway.

Figure 1. The services and connections of the ITS application
The VST is the entry point for video data. It manages cameras and video streams efficiently on Jetson-based platforms, providing hardware-accelerated video decoding, streaming, and storage from multiple video sources. In this setup, the video input file is streamed into the VST using RTSP. For more information on using VST and adding RTSP streams, see the VST documentation.
Next, the video data flows into the AI Perception service, which leverages NVIDIA DeepStream SDK using a YOLOv8 object detection model for high throughput, followed by object tracking using the NvDCF tracker. The pipeline generates metadata based on NVIDIA Metropolis schema, capturing class and localization information for various objects detected in the scene.
The generated metadata and events are then published to a Redis message bus, which acts as the backbone for messaging within the system. The AI Analytics service subscribes to this bus, receiving the necessary information to perform detailed traffic analysis.
This services-based architecture provides a smooth and efficient flow of data from video input to analytics, leveraging the processing power of NVIDIA Jetson devices. This approach enhances processing speed and responsiveness, making it ideal for ITS applications that require real-time data interpretation and immediate actions.
YOLOv8 for object detection
YOLOv8 stands out as a state-of-the-art object detection model known for its unparalleled speed and accuracy. Its lightweight architecture makes it particularly well-suited for deployment on edge devices such as NVIDIA Jetson. In ITS applications, YOLOv8 can detect and classify objects such as vehicles, pedestrians, and traffic signs in real time. This can provide essential data for managing and optimizing traffic flow, enhancing road safety, and supporting automated traffic systems. For more information about various YOLO models, see A Comprehensive Review of YOLO Architectures in Computer Vision.
Download and prepare YOLOv8
To get started, download the YOLOv8 model from the ultralytics GitHub repo. This post uses the car, bus, and truck classes from the COCO dataset that the release version of YOLOv8 was trained on. Note that the user is responsible for verifying that each dataset license is fit for the intended purpose.
The model then needs to be converted into an NVIDIA TensorRT execution engine, which optimizes it for the hardware capabilities of NVIDIA Jetson. The DeepStream microservice container comes with a script to help streamline this process.
To run the YOLOv8 setup script, first ensure you have followed the steps outlined in the Quick Start section of the Jetson Platform Services documentation to install the microservices, reference application, and NVStreamer. You can also configure the NVStreamer to stream the file below through RTSP at this time. This will be used as the input.
opt/nvidia/deepstream/deepstream/samples/streams/sample_1080p_h264.mp4
To execute the script, run the command for your hardware, provided below.
Jetson AGX Orin:
sudo docker run -v ./yolov8s:/yolov8s -v
./config/deepstream:/ds-config-files –rm --runtime nvidia
nvcr.io/nvidia/jps/deepstream:7.0-jps-v1.1.1
/yolov8s-files/yolov8s_setup.sh --agx
Jetson Orin NX16:
sudo docker run -v ./yolov8s:/yolov8s -v
./config/deepstream:/ds-config-files –rm --runtime nvidia
nvcr.io/nvidia/jps/deepstream:7.0-jps-v1.1.1
/yolov8s-files/yolov8s_setup.sh --nx16<
Tasks performed by the setup script include:
- Hardware-specific configuration: Adjusts parameters like batch size based on the NVIDIA hardware (AGX or NX16) to optimize performance.
- Dependency management: Downloads YOLOv8 model files and COCO dataset, installs required libraries, and prepares calibration images for quantization.
- INT8 calibration: Quantize the floating point model to INT8 for optimal inference performance.
- Model conversion: Converts the model from PyTorch to ONNX format and generates the TensorRT engine.
This process takes about 15 to 30 minutes and generates the following files necessary for YOLO deployment:
./yolov8s/calib.table./yolov8s/model_b4_gpu0_int8.engineor (depending on the device type)./yolov8s/model_b8_gpu0_int8.engine./yolov8s/yolov8s-dependencies/yolov8s.onnx
Customize the AI Perception service
The DeepStream container used for AI perception also includes a library containing custom functions for creating an optimized NVIDIA TensorRT engine from the YOLOv8 model and parsing the model’s output. Both the conversion script and the library are sourced from marcoslucianops/DeepStream-Yolo GitHub repo (MIT license).
The custom functions are used to configure the DeepStream inference plug-in:
# Example: nv_ai/config/deepstream/yolov8s/config_infer_primary_yoloV8_nx16.txt
...
parse-bbox-func-name=NvDsInferParseYolo
custom-lib-path=/yolov8s-files/libnvdsinfer_custom_impl_Yolo.so
engine-create-func-name=NvDsInferYoloCudaEngineGet
…<
Run the application
With the setup complete, you’re ready to run the application. Docker Compose configurations for the application are included with the AI-NVR stack. Use the appropriate command for your hardware configuration, provided below.
Jetson AGX Orin:
sudo docker compose -f compose_agx_yolov8s.yaml up -d --force-recreate
Jetson Orin NX16:
sudo docker compose -f compose_nx16_yolov8s.yaml up -d --force-recreate
Vehicle analytics using the AI Analytics service
Vehicle traffic analysis can be performed using the Tripwire (or line-crossing) and Trajectory features of the AI Analytics service. You can configure these analytics using REST APIs. The analytics include:
- Total vehicle count (car, bus, and truck) crossing a configured line segment for a given time range.
- Trend of vehicle traffic over a given time range with smaller time-window drill-downs.
- Heat map of vehicle traffic flow for a given time range.
Concepts
Tripwire, or line-crossing, refers to virtual lines drawn on the camera plane, used to count the object crossing the line in either direction.
Trajectory refers to the actual path a vehicle takes, tracked on a frame-by-frame basis by the system and recorded. Each vehicle is assigned a unique ID by the AI Perception service. The total path for a vehicle is represented by the concept of Trajectory in the system.
API specification
Refer to the AI Analytics Service API specification for details about APIs referenced in the following sections.
Tripwire configuration
Tripwire analytics can be configured for the given sensor using the following APIs. Note that the <SensorID> values used below should be the same as the name value set while adding streams to VST using the sensor/add API. The HTTP post request can be issued using a tool such as cURL or Postman.
HTTP POST request endpoint:
http://{jetson-device-ip}:30080/api/emdx/api/config/tripwire?sensorId=<SensorID>
Note that jetson-device-ip must be replaced with the correct IP address of the Jetson device.
Request:
{
"sensorId": "<SensorID>",
"tripwires": [ {
"id": "<TripwireID>",
"name": "<Name>",
"wire": [
{
"x": 591,
"y": 575
},
{
"x": 677,
"y": 618
},
{
"x": 1107,
"y": 575
},
{
"x": 1105,
"y": 541
}
],
"direction": {<
"p1": {
"x": 873,
"y": 553<
},
"p2": {
"x": 1010,
"y": 689
},
"entry": {
"name": "entry"
},
"exit": {
"name": "exit"
}
}
}
]
}
Generating Tripwire time series analytics
Total crossings for a given time range by different vehicle types (as detected by the YOLOv8 model) are retrieved through the Tripwire counts API.
Once the tripwire has been created, retrieve the total object crossings across tripwire with ID road-tw configured on sensor ID ExpressWay between 11AM GMT to 12PM GMT on 2024-05-15 using the sample query below. Additionally, the query requests a break-up of counts for the car, bus, and truck object types.
HTTP GET query:
http://{jetson-device-ip}:30080/emdx/api/metrics/tripwire/count?
     sensorId=ExpressWay&
     tripwireId=road-tw&
     fromTimestamp=2024-05-15T11:00:00.000Z&
     toTimestamp=2024-05-15T12:00:00.000Z&
     objectTypes=car,bus,truckc
Note that, as before, jetson-device-ip must be replaced with the correct IP address of the Jetson device.
Response:
{ "counts": [
{
"sensorId": "ExpressWay",
"total_count": 241,
"count_by_type": {
"bus": 3,
"car": 238,
"truck": 0
},
"attributes": []
}
]
}
Traffic trend histogram visualization
The previous total count can also be aggregated into smaller windows of time using the Tripwire counts histogram API.
Use the sample query below to retrieve the object (all types) crossing counts histogram for tripwire with ID road-tw configured on sensor ID ExpressWay between 11AM GMT to 12PM GMT on 2024-05-15, broken down to a 1-minute window.
HTTP GET query:
http://{jetson-device-ip}:30080/emdx/api/metrics/tripwire/histogram?
     sensorId=ExpressWay&
     tripwireId=road-tw
     fromTimestamp=2024-05-15T11:00:00.000Z&
     toTimestamp=2024-05-15T12:00:00.000Z&
     fixedInterval=60000&
     objectTypes=car,bus,truck
This will dump a JSON output of each 1-minute interval and total aggregated count in the 1-minute window. You can plot this information in a stacked histogram representing counts trend over time (Figure 2).

Figure 2. Traffic count histogram at 1-minute intervals
Vehicle trajectory heat map visualization
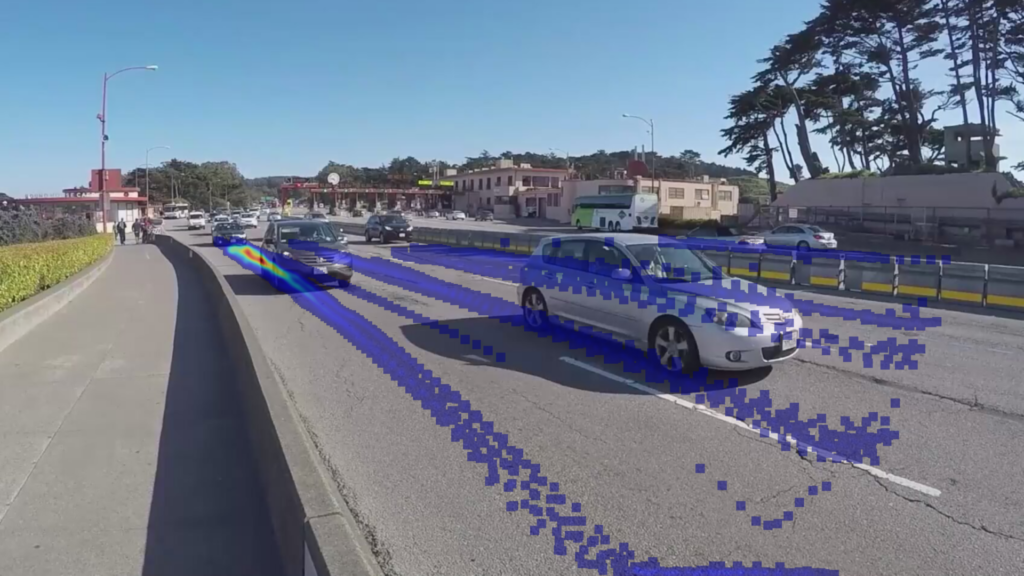
This section shows how to use the behavior APIs from the AI Analytics service to generate heat maps. The heat map provides a visualization to understand traffic flow over time. It’s generated by accumulating individual trajectories of movement and mapping them spatially over the region.

Figure 3. Heat map of moving traffic
Heat map generation logic
Using the trajectory behavior coordinates [x,y] for all objects for a given time range, a histogram is computed using numpy.histogram2d. A Gaussian filter is applied to smooth the results. Visit NVIDIA-AI-IOT/jetson-platform-services on GitHub to see the notebook for the functions related to this logic. The sensor image snapshot is acquired using the VST API. In Figure 3, the smoothed histogram is visualized to generate a heat map.
Use the sample query below to retrieve the trajectory behaviors for sensor ID ExpressWay for a given duration for object types car, bus, and truck.
HTTP GET query:
http://{jetson-device-ip}:30080/emdx/api/behavior?
     sensorId=ExpressWay&
     fromTimestamp=2024-05-15T11:00:00.000Z&
     toTimestamp=2024-05-15T11:00:05.000&
     objectTypes=car,bus,truck
Response:
{
"behavior": [
{
"sensor": {
"id": "Expressway"
},
"object": {
"id": "134",
"type": "car"
},
"locations": {
"coordinates": [
[
1708598580297,
[291,590]
],
[
1708598580364,
[285,594]
],
[
1708598580474,
[385,694]
],
[
1708598580372,
[281,595]
] ],
"type": "linestring"
},
"length": 4,
"start": "2024-02-22T10:43:00.297Z",
"end": "2024-02-22T10:43:01.255Z",
"distance": 204.81118737109063,
"timeInterval": 0.958
}
]
}
The response is an array of trajectory items for a given object over time, where each item is an array of two elements. The first element is a timestamp (1708598580297, Unix Time) in milliseconds of video frame. The second element is an array of location coordinates [x,y], or [291,590], where x=291 and y=590 in the image plane.
Traffic analytics notebook
Visit NVIDIA-AI-IOT/jetson-platform-services on GitHub to download the notebook and run it locally on your system. Follow the step-by-step instructions for trying this with your own video file or camera.
Summary
This post has explained how to build intelligent transportation applications using Jetson Platform Services from NVIDIA JetPack 6.0 and the YOLOv8 object detection model. Jetson Platform Services is a set of feature-rich microservices to build AI applications at the edge. Developers can quickly and efficiently build applications using the APIs and generate insights such as vehicle counts, traffic heat maps, and more. These microservices are fungible and can be extended to many edge AI applications.
Download JetPack 6.0 and get started with Jetson Platform Services. Ask questions and join the conversation on the NVIDIA Developer forum.
Related resources
- GTC session: Taking Generative AI and Vision AI to Production at the Edge
- GTC session: Building GPU-Accelerated Streaming AI Pipelines With Holoscan SDK
- NGC Containers: AI Analytics
- NGC Containers: VLM Inference Service (Jetson)
- NGC Containers: AI Analytics Web API
- SDK: JetPack SDK
Alvin Clark
Product Marketing Manager, DeepStream, NVIDIA
Tarun Rathor
System Software Manager, NVIDIA
Bhanu Pisupati
Design and Development Lead, Metropolis, NVIDIA
Hasaan Farooq
Software Engineer, NVIDIA
Mansi Goel
Software Engineer, NVIDIA